
A few years ago, I was employed as an Operations engineer working under a State General Manager, for an international engineering company. Our annual State revenue was in excess of AU$100m and on the books we held around 500 local staff; with a mixture of permanent full-time, project hire and contract hire employees.
The time was pre-GFC 2007-2008 and like many companies at the time, we were struggling with a very high staff turn over. It was the boom-time, and the demand for resources, an employee’s market, had led to significant churn. Or at least, that is what HR was leading people to believe during the annual senior leadership meeting.
Taking centre stage in the conference room, the HR manager delivered a short presentation on the year past. The projector flashed colourful tables full of data, including a few pie charts, and a couple of graphs to support the conclusion that; its an employee’s market, but we can do better. We had a staff turn-over in excess of 20%. Which meant 20% of our staff (or roughly 100 people) would up-and-leave and need to be replaced each year. Adding to the challenges we faced, the company was growing, so, not only did we need to hire 100 people each year, but in fact we needed more to offset our staff losses.
The problem (as I saw it at the time) was that what we had failed in two very important undertakings, i.e. to;
- Define the problem, and
- Develop a strategy to fix the problem
In very broad brush statements, managers were told that things needed to improve. That people were looking elsewhere, and they should be trying their hardest to retain the best staff. Graphs flashed across the screen showing what everyone expected; graduates who had been trained up, were most likely to depart, in a distant second came the experienced engineers and they were followed by the grey-beards.
Dissatisfied with the lack of detail, and supported by the leadership team, I embarked on a journey to challenge our perceptions. My first step, to gingerly coax the HR department to hand over all employee exit-interview data for my analysis. Finally having pried redacted data from HR’s cold-dead-hands, I undertook a detailed analysis of the reasons people were leaving, and what managers and companies could do about it.
The Method
The first step was to develop a strategy for analyzing the data. There was a mixture of 1-10 score, poor-great, categorical and multi-choice survey data, along with written statements and paragraph style responses to questions.
I settled on an approach that took both a quantitative, and qualitative view of the respective data sets. Dividing the employees into 5 year age bands, and analysing the reasons for leaving in each band.
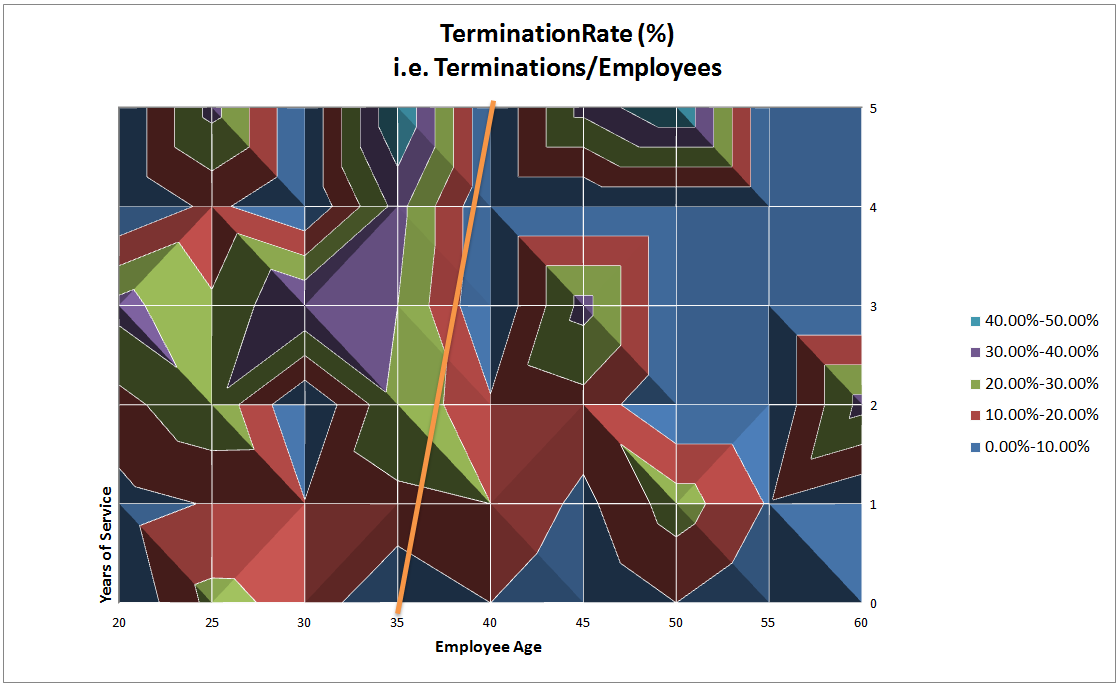
For age-years of service, I developed a normalised heat-map which determined how long someone would give the company before considering alternatives. While the sheer number of young engineers meant their exit numbers were high, normalising the data with the banded population showed an interesting trend.
Disclaimer: I preface this conclusion by noting that the data set it not exhaustive, and doesn’t represent all companies. Furthermore, due to the limited data set for older employees, the 50+ age band can not be said to be a representative set for all behaviors.
While the trends clearly showed that young engineers were highly likely to change jobs within 2 – 5 years, more interestingly, older engineers were also hedging their bets. Alarmingly the data showed that across the board (all age groups) the Company had less than 1 year to impress their new entrants.
In reading the chart above, we can follow the orange line for a typical 35 year old entrant; here we see that the risk of such an employee voluntarily leaving the company is significantly higher within the second year of service and drops off after that. Meanwhile 45 year old employees with 3 or more years of service are at higher risk of being lured away.
For rank-style questions, I developed a heat-map for determining the score for each age band. The data demonstrated the reasons why employees were leaving the company and definitive patterns could be seen between two age bands, the <30 year old, and >30 year old. I figured this was a good split, primarily because it distinguished between engineering staff who were “developing” and those who were “experienced” . Having identified which individuals were at risk, and knowing how long a company had to make a positive impact (see above). This data could tell us what to do about it; by addressing the reasons they were leaving.
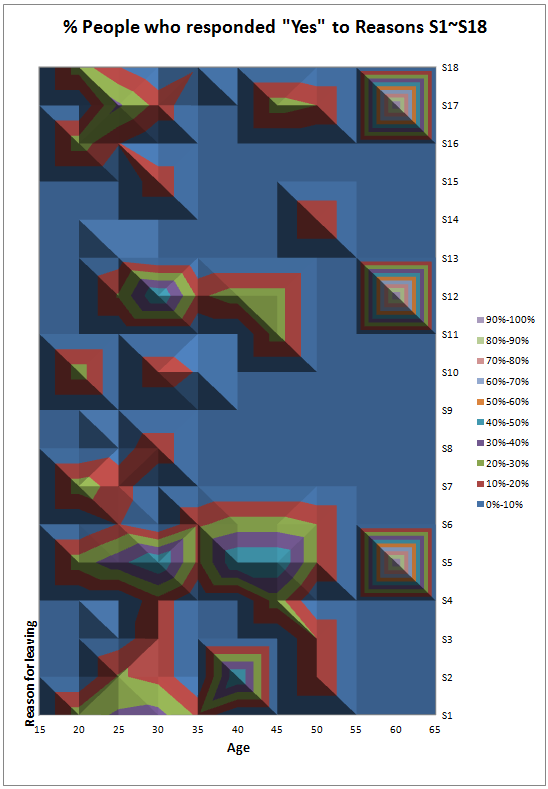
Reasons marked by employees are below:
- Career change
- Expectations not met
- Not getting the recognition I deserve
- Don’t get on with supervisor/manager
- Better opportunity
- Dissatisfaction with type of work I do
- Not getting the training I need or want
- Family responsibilities
- Health
- Relocation
- My values are not aligned with the Company
- To work elsewhere
- Don’t get on with colleagues
- Dissatisfaction with benefits offered
- Dissatisfaction with physical environment
- Furthering my education
- Higher salary
- Lifestyle change
For qualitative paragraph style question responses, I looked further at significant words, and analyzed the frequency of each word used. It was evident from this approach that the two age bands had different problems which needed to be addressed independently.
|
Under 35 |
Over 35 |
||||
|
Rank |
Key Word |
Freq. |
Rank |
Key Word |
Freq. |
|
1 |
work |
48 |
1 |
work |
40 |
|
2 |
project |
44 |
2 |
project |
30 |
|
3 |
Training / Study |
39 |
3 |
role |
30 |
|
4 |
opportunity / challenge / variety |
29 |
4 |
KPIs |
23 |
|
5 |
role |
27 |
5 |
Training / Study |
20 |
|
6 |
KPIs |
25 |
6 |
opportunity / challenge / variety |
15 |
|
7 |
manager |
23 |
7 |
leader |
13 |
|
8 |
communication |
21 |
8 |
manager |
12 |
|
9 |
graduate |
20 |
9 |
career |
9 |
|
10 |
leader |
19 |
10 |
branch office |
8 |
|
11 |
feedback |
13 |
11 |
move/transfer |
7 |
|
12 |
alliance |
12 |
12 |
support |
6 |
|
13 |
experience |
11 |
13 |
position |
6 |
|
14 |
support |
9 |
14 |
review |
5 |
|
15 |
development |
8 |
15 |
communication |
4 |
|
16 |
environment |
8 |
16 |
alliance |
4 |
|
17 |
design |
8 |
17 |
development |
4 |
|
18 |
career |
7 |
18 |
environment |
4 |
|
19 |
review |
6 |
19 |
procedures |
4 |
|
20 |
job |
6 |
20 |
path |
4 |
|
21 |
move/transfer |
5 |
21 |
recognition |
4 |
|
22 |
pay |
5 |
22 |
executive team |
4 |
|
23 |
mentor |
5 |
23 |
feedback |
3 |
|
24 |
contact |
5 |
24 |
job |
3 |
|
25 |
position |
4 |
25 |
pay |
3 |
|
26 |
procedures |
4 |
26 |
relationship |
3 |
|
27 |
clarification of role |
3 |
27 |
isolation |
3 |
|
28 |
flexibility |
3 |
28 |
clarification of role |
2 |
|
29 |
path |
2 |
29 |
experience |
1 |
|
30 |
travel |
2 |
30 |
design |
1 |
|
31 |
assistance |
2 |
31 |
mentor |
1 |
|
32 |
branch office |
1 |
32 |
flexibility |
1 |
|
33 |
recognition |
1 |
33 |
travel |
1 |
|
34 |
relationship |
1 |
34 |
graduate |
0 |
|
35 |
cadet |
1 |
35 |
contact |
0 |
|
36 |
executive team |
0 |
36 |
assistance |
0 |
|
37 |
isolation |
0 |
37 |
cadet |
0 |
Conclusions?
These technique demonstrates the relative importance of the various aspects of one’s life in the office. The type of Work and Projects on offer were most critical across the board, and significant weight was placed on Training, new/better opportunities, the role being undertaken and the KPI review process.
Clear differences exist as we progress down the list of words; people under 35 were interested more in training and future opportunities. They were heavily focused on the graduate development program, obtaining feedback, good communication, the experience they were getting and their manager and team leader. The responses also indicated an interest in having the right support and development.
People over 35 focused on areas such as their role and the KPI review process first, closely followed by new opportunities and similarly their respective Manager and team leader and career path. Other issues included the location of their work, and the lack of opportunities in the a particular branch office.
What was also clear is how infrequently money really came into it. Again proving that money is a maintainer, and not a motivator.
Future work?
It is worthwhile pointing out that companies, and their managers need to develop a meaningful understanding of the issues present amongst their workforce. Only by identifying problems and working through a range of solutions can plug the holes which create high staff turn over.
It’s important to realise that these conclusions are not immune to market forces. In fact, a slow economy with fewer business opportunities is more likely to lead to job dissatisfaction; making it a real challenge to keep hold of the guru’s who are critical to a business’ success.
Feel free to share your thoughts on how to keep these people engaged, active, motivated, and happy.. or even share your own thought on the conclusions or data herein.
